Cleveland's Coldest And Warmest Months Have An Average Temperature Difference Of 22 Degrees, Making Our People Hardy
By Nikki Rhoades|Published December 21, 2020
×
Nikki Rhoades
Author
Nikki is a lifelong Ohioan with a love for literature. She holds a Bachelor's Degree from the University of Akron and has enjoyed publishing her written work since 2007. She has a love of travel and does so frequently, though she believes that home is where the heart is — she continues to work in and around Cleveland as a digital content specialist to this day, working on everything from commercial scripts and social media posts to grassroots marketing initiatives.
Climate and weather, believe it or not, are different things. Weather reflects short-term conditions, like a rainy day or sunny weekend. Climate, of course, is a proven average found by observing daily weather over the course of years. Here in Cleveland, our climate may seem extreme to some. We see precipitation nearly 150 days each year, but that’s not even the weirdest thing when it comes to our climate. What is the climate in Cleveland like? Let’s take a look using statistics to see how our weather conditions compare to the rest of the U.S.
We've all heard the saying: "If you don't like Cleveland's weather, just wait five minutes." However, this variation boils down more to our climate, or our proven record of common weather events.
Today, we're going to take a look at some climate facts as presented by Best Places. The website allows a factual presentation of common weather and climate patterns alongside user-generated ratings of different places. There's a lot of neat stuff on the site, so feel free to poke around and dig up info on the suburbs or your childhood hometown for more info.
Cleveland's coldest month is January, where temperatures plummet to just an average of 21.9° F.
Believe it or not, this is warmer than many other places in Ohio. Why? The answer lies just barely north of us... it's Lake Erie! In the winter, the water actually retains a bit of heat, allowing the shoreline a pleasant and consistent warmth.
Advertisement
To provide a bit of visual contrast, the hottest month is July, when temperatures soar up to around 82.4° F.
If you're unfamiliar with Northeast Ohio, this is a humid heat. From June through September each year, temperatures tend to hover above 70° F, where locals don shorts and tank tops to keep cool.
Advertisement
Throughout the year, this great variation provides Cleveland an average of 166 sunny days each year.
The national average, according to Best Places, is 205 sunny days per year. Yikes! We may live on the darker side, but at least our weather events are beautiful. There's nothing that quite compares to the might and beauty of a storm over Lake Erie!
In terms of snowfall, we receive an average of 54 inches of snow per year in Cleveland... nearly double the national average of 24 inches per year.
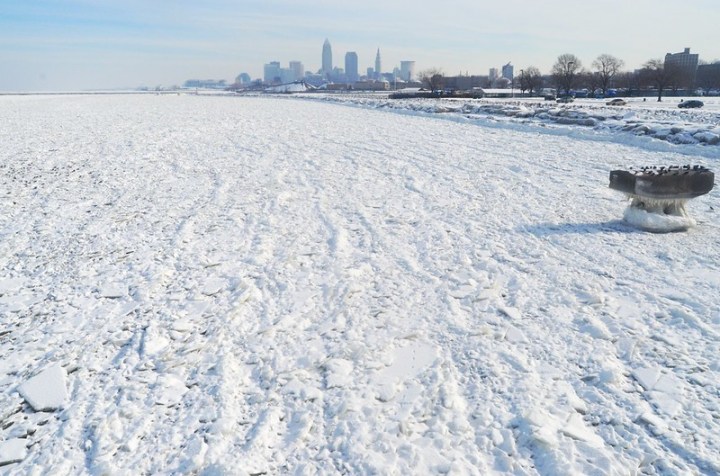
And, of course, we spend half of the year under a layer of snow in Cleveland. This means an average of 100.6 days where temperatures dip below freezing.
Brrr! Things definitely get chilly in Cleveland. In fact, the coldest temperature ever recorded in Cleveland was -20° F. And that was just Cleveland! Around the same time, Ohio suburbs recorded slightly different temperatures. Mansfield was around -36° F at that time!
However, we do get a few hot days... we spend about nine days a year enjoying temperatures around 90° F.
Now that's beachgoing weather. So, what is the hottest temperature ever recorded in The Land? In the late 1980s, Clevelanders were cookin' as temperatures rose to a toasty 104° F.
Resident humans and critters alike have to prepare for this tremendous variation, leading many birdbrains to migrate to or from Ohio in select seasons.
These smart cookies know that extreme temperatures aren't ideal, so they head elsewhere outside of breeding season. Our annual fall migration actually extends into the winter months, as many species (waterfowl, in particular) head south. However, many birds stay in Ohio in the winter.
Advertisement
All in all, the extremes of life in Cleveland balance out. Our climate isn't too bad, at all!
Yes, we get lake effect snow. Yes, below freezing temperatures are common. However, Best Places ranks our comfort index at 6.8... nearly comparable to the national average of 7. This does vary from month to month, but Northeast Ohio really isn't too bad a place to call home.
No matter the season, it's worth setting aside some time to appreciate Greater Cleveland's gorgeous landscape and varied climate.
When it comes to climate in Cleveland, our local landscape sees quite a bit of annual variation. From the sun-kissed flowers of summer to the snow-encased windows each winter, our landscape changes quite a bit each year. What is your favorite season? Tell us in the comments!
Historically, we’ve seen a few odd seasons that deviate from our annual climate. Check out our list of the most memorable winters in Cleveland for a few incredible and surprising weather-related events.
OnlyInYourState may earn compensation through affiliate links in this article. As an Amazon Associate, we earn from qualifying purchases.