
Here Are The 7 Unhealthiest Counties In Arizona

Monica Spencer
Author
Last week, we reviewed some of the healthiest counties in Arizona. The rates for each individual one could use some improvement. For example, the obesity rate in every single one never dipped below 22%, meaning more than 1 in 5 adults in the healthiest county were severely overweight and this alone can lead to a multitude of health problems.
So, which counties need to improve their health? The following seven according to County Health Rankings & Roadmaps. Just keep in mind that the data included is just a snapshot of all the different factors that go into determining the health rate of each county. Also, in general, lower numbers are a good thing when looking at this particular list. The only exception here is the food environment index, which measures both reliable access to food and access to healthy foods. Ideally, that number should be at 10.
Rate of poor or fair health: 19%
Adult obesity rate: 35%
Food environment index: 6.1 out of 10
Physical inactivity rate: 24%
Total years of death occurring before age 75: 7,350 years
Rate of uninsured population: 21%
Rate of poor or fair health: 19%
Adult obesity rate: 24%
Food environment index: 6.4 out of 10
Physical inactivity rate: 21%
Total years of death occurring before age 75: 7,412 years
Rate of uninsured population: 19%
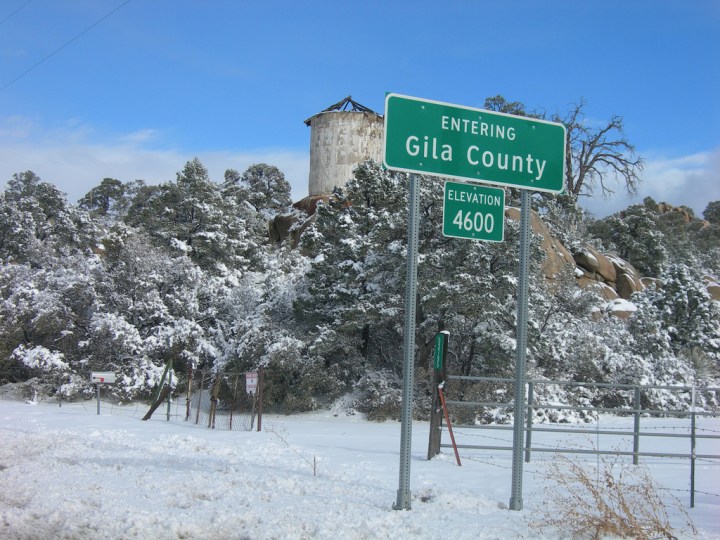
Rate of poor or fair health: 20%
Adult obesity rate: 27%
Food environment index: 5.4 out of 10
Physical inactivity rate: 31%
Total years of death occurring before age 75: 10,462 years
Rate of uninsured population: 23%
Related Stories
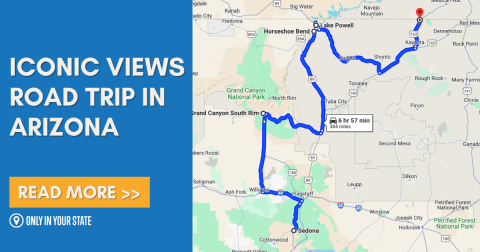
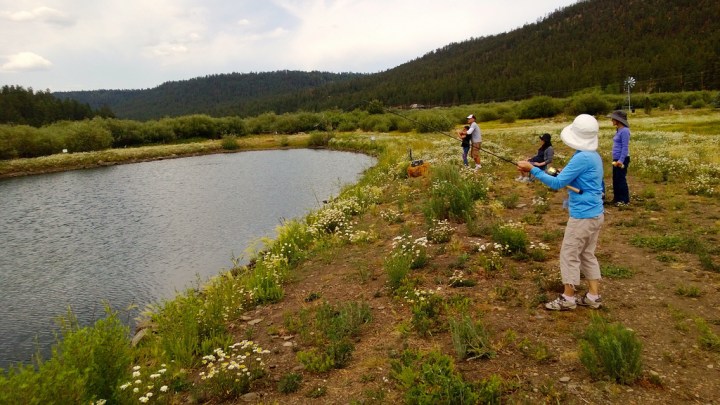
Discover 5 Of Arizona's Most Iconic Views On This Epic 7-Hour Road Trip
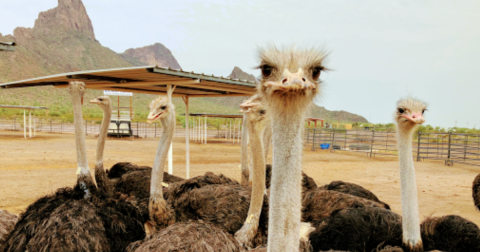
The Entire Family Will Love Visiting This Fantastic Farm In Arizona With A Petting Zoo, Animal Feedings, And Monster Truck Tours

The Whole Family Could Spend An Entire Day Having A Blast At The Yard In Arizona

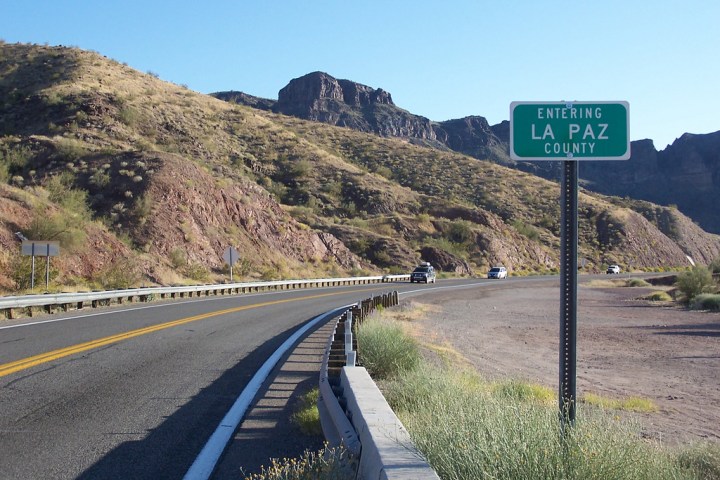
Rate of poor or fair health: 18%
Adult obesity rate: 31%
Food environment index: 4.3 out of 10
Physical inactivity rate: 24%
Total years of death occurring before age 75: 12,512 years
Rate of uninsured population: 23%
Rate of poor or fair health: 20%
Adult obesity rate: 32%
Food environment index: 0.9 out of 10
Physical inactivity rate: 22%
Total years of death occurring before age 75: 14,350 years
Rate of uninsured population: 25%
Rate of poor or fair health: 22%
Adult obesity rate: 32%
Food environment index: 5.5 out of 10
Physical inactivity rate: 31%
Total years of death occurring before age 75: 13,462 years
Rate of uninsured population: 27%
Rate of poor or fair health: 21%
Adult obesity rate: 27%
Food environment index: 6.2 out of 10
Physical inactivity rate: 25%
Total years of death occurring before age 75: 10,899 years
Rate of uninsured population: 21%
Do you agree with these rankings? What are some ways you think the residents can begin to improve their health? We would love to hear your comments below or on the Facebook page!
OnlyInYourState may earn compensation through affiliate links in this article. As an Amazon Associate, we earn from qualifying purchases.